


What is business process analysis?
Business Process Analysis (BPA) is the discipline that makes it possible to observe and evaluate systematically how the activities within an organisation work.
Its objective is to identify strengths, inefficiencies, redundancies and improvement opportunities in order to increase the company’s productivity and effectiveness.
A business process can be defined as the coordinated set of activities, resources and people that transform an input (e.g. a customer request, a raw material, a piece of data) into an output (e.g. a product, a service, a report).
Analysing processes therefore means understanding how work is really done in the company, not just how flows were designed on paper.
What it involves
Process analysis is not a one-off exercise, but a structured journey that includes:
Data collection – direct observation, interviews, document analysis
Mapping – graphical and schematic representation of activities and decision flows
Measurement – definition of KPIs and benchmarks to understand whether a process is efficient or not
Identification of waste and bottlenecks – anything that adds no value for the customer or generates unnecessary costs
Why it matters
- Processes are the backbone of an organisation: if they are inefficient, the entire company suffers in terms of costs, time and quality.
- Analysis helps to capture the current state (“as is”) and to define the ideal process (“to be”), highlighting gaps and areas for intervention.
- It is the starting point for Lean Management, Six Sigma and digitalisation initiatives, because processes cannot be improved or automated without a clear understanding of them.
The difference between a process and an activity
A common mistake is to confuse processes with individual operational activities.
- An activity is a single action (e.g. recording an invoice).
- A process is the organised sequence of activities that leads to a result (e.g. the invoicing cycle: issue → recording → check → collection).
Understanding this difference is essential: process analysis does not focus on the individual task, but on the big picture and on the relationships between the various activities.
The phases of a business process analysis
An effective analysis does not stop at drawing abstract flows: it is a structured, multi-phase journey that starts with observation and leads to continuous improvement.
Here are the main steps:
Why Us
fischer Consulting’s business process mapping
A well-structured analysis takes into account:
Hierarchical structure and organisation chart
Clarity of roles
Processes and information flows
Operational and communication efficiency
Skills and human resources
Alignment between people and objectives
Company culture
Shared values and behaviours
Monitoring systems
Indicators and control tools
Our approach
A structured three-phase journey
Case study
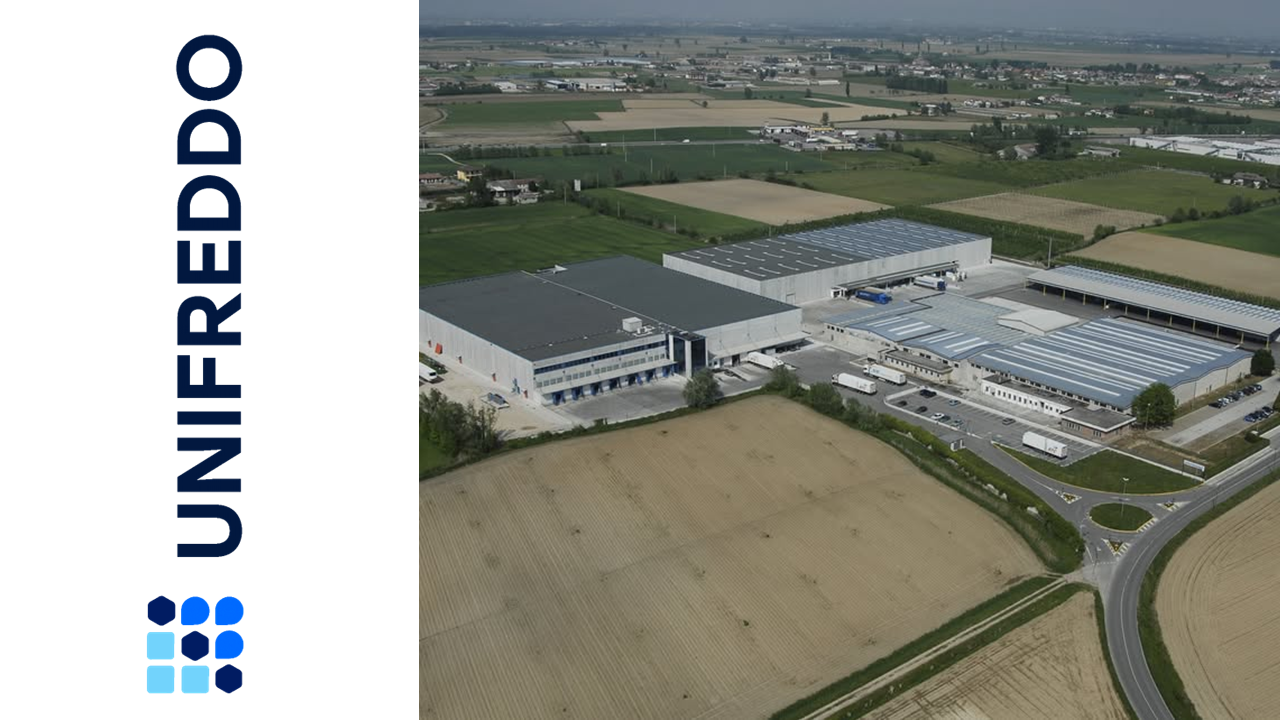
The Unifreddo case: redesigning business processes
Sector
Cold chain logistics and food distribution
fischer Consulting supported Unifreddo, a leading company in cold chain logistics and food distribution, in mapping and analysing its business processes ahead of the opening of a new facility.
The project included the design of an optimised operational layout, the definition of the future-state flow map and the evaluation of the most efficient logistics and infrastructure solutions – including drive-in and mobile racking, reach trucks and VNA turret trucks.
Thanks to an accurate benchmark analysis, concrete and measurable results were achieved:
- −71% reduction in work in progress (WIP)
- −57% in put-away time for inbound pallets
- −54% in pick-face replenishment (let-down) time
The project enabled Unifreddo to streamline workflows, reduce waste and boost the overall productivity of its facilities, ensuring smoother, traceable and more sustainable logistics.
our tools
Lean Tools for Process Improvement
5S
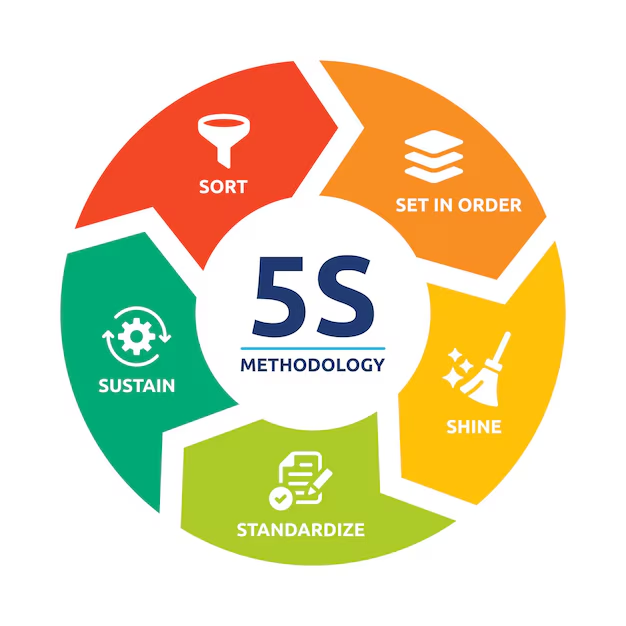
This method focuses on organising the workplace through Sort, Set in order, Shine, Standardise and Sustain, thereby reducing waste and increasing productivity (in Japanese: Seiri, Seiton, Seiso, Seiketsu, Shitsuke).
Kanban
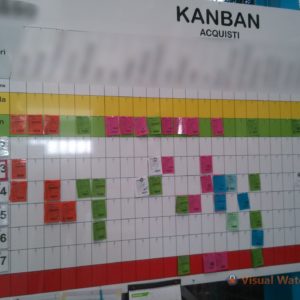
Kanban is a visual method for managing production and workflow. Using cards and signals, Kanban helps to coordinate activities, reduce excess inventory and identify resource overload or under-utilisation.
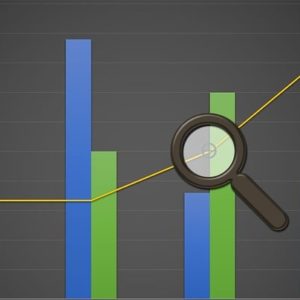
Yamazumi Chart
This tool is used to analyse and balance the workload across the different workstations in a production process. By visualising cycle times and activities, the Yamazumi Chart helps to identify critical points and optimise the allocation of resources.
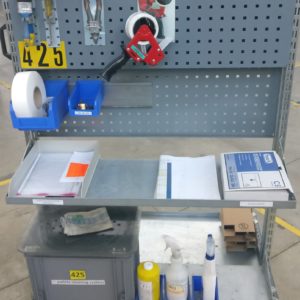
SMED (Single-Minute Exchange of Die)
SMED is a methodology for reducing changeover times between production runs. By optimising machine set-up and standardising procedures, companies can reduce downtime and increase operational flexibility.
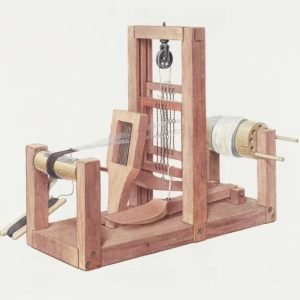
Jidoka
This concept refers to building quality into the production process, enabling machines to detect errors automatically and stop when a problem occurs. Applying Jidoka helps to ensure high-quality production and to prevent defects.
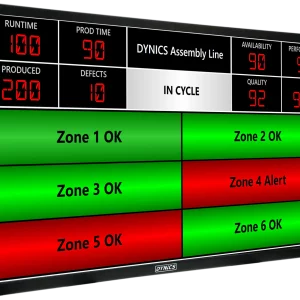
Andon
A visual signalling system used to communicate problems or anomalies in the production process immediately. Its implementation promotes transparency and responsiveness, enabling timely intervention to solve problems.
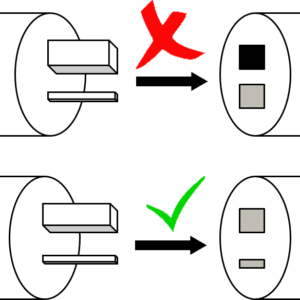
Poka-yoke
This technique aims to prevent errors or defects through the design of processes or devices that stop errors from occurring. Poka-yoke solutions are often implemented creatively to ensure that operations are carried out right first time.
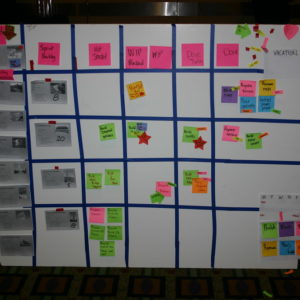
Visual Management
This approach uses signage, charts and visual indicators to communicate critical information on the status of processes and performance, helping to keep the focus on continuous improvement and fostering a results-oriented culture.
our tools
Analysis tools and methods
The efficiency of a process is assessed through key parameters that allow us to compare the current state with the desired objectives.
The main ones include:
Standard Cycle Times
Standard cycle times represent the optimal expected time to perform an activity or process under normal conditions and without interruptions. They serve as a reference for evaluating the actual performance of processes and identifying any significant deviations.
Cycle Times
Cycle time is the actual time needed to complete a process or a single activity, from start to finish. Comparing actual cycle times with standard cycle times reveals inefficiencies: pauses, waiting, bottlenecks or unnecessary activities.
Takt Time
Takt Time indicates the pace at which a product or service must be completed to meet customer demand. It is calculated by dividing the available time by the number of units required.
Example: if a company has to produce 500 pieces in a 25,000-second shift, the Takt Time is 50 seconds.
Overall Equipment Effectiveness (OEE)
OEE (Overall Equipment Effectiveness) is an indicator that measures how productive a plant or machine really is compared with its maximum potential. It takes into account: Availability, Performance and Quality. Monitoring these indicators is essential to identify areas of inefficiency and guide targeted interventions.
Problem-solving methodologies
To tackle organisational and operational challenges, we apply structured problem-solving methodologies that go beyond the symptoms to the root causes:
PDCA (Plan-Do-Check-Act) → continuous improvement cycle.
A3 Problem Solving → a structured, visual approach to problem solving.
Root Cause Analysis (RCA) → a structured methodology to identify and eliminate the root causes of inefficiencies and process problems
This approach makes it possible to solve problems immediately and, above all, to lay solid foundations for continuous, lasting improvement.
Areas of application
The analysis can be applied to any business function, in particular:
Production
shorter cycle times, better quality.
Logistics and supply chain
optimisation of warehouse and distribution flows.
Maintenance
reduction of plant downtime and costs.
Internal services (HR, administration)
simplification of procedures and information flows.
Customer service
faster response times and a better customer experience.
The results
Analysis outputs
At the end of the journey, the company receives:
Detailed process map
A detailed process map with critical areas highlighted
Executive Report
An Executive Report with Job Stoppers, Opportunities, Quick Wins and Best Practices
Concrete improvement plan
A concrete improvement plan, with KPIs, timescales and intervention priorities.
Concrete benefits
By analysing and improving their business processes, companies can achieve:
Efficiency → less waste and lower operating costs.
Speed → shorter cycle times and greater responsiveness.
Quality → fewer errors and standardised activities.
Flexibility → processes that adapt more easily to market changes.
Engagement → more motivated staff thanks to clear roles and support tools.
In this way, analysis does not remain theory but becomes a genuine operational tool for growth.
Start mapping your processes
Request a consultation now