




An efficient company cannot do without a clear, functional organisational structure.
Organisational analysis aims to evaluate roles, responsibilities and decision-making flows, with a focus on reducing redundancies and optimising collaboration between departments.
It is not just about redrawing organisation charts: a well-structured organisation ensures greater responsiveness, faster decisions and more effective change management.
identify inefficiencies and overlaps
clarify roles and responsibilities
improve communication between departments
increase staff productivity and motivation
Our method combines quantitative and qualitative tools to obtain a complete picture of the company’s organisation.
Organisational analysis is carried out in three phases:
Alongside DILO, we also use other tools such as:
to clarify roles and responsibilities
to gather people’s perceptions
to measure efficiency and resource alignment.
To understand how an organisation really works, it is not enough to analyse documents or formal processes: you need to observe day-to-day operations.
One of the most effective tools we use is DILO (Day In the Life Of) mapping.
This approach delivers concrete, measurable results across five key dimensions:
Efficiency → less waste and lower operating costs.
Speed → shorter cycle times and greater responsiveness.
Quality → fewer errors and standardised activities.
Flexibility → processes that adapt more easily to market changes.
Engagement → more motivated staff thanks to clear roles and support tools.
Combining these tools enables us to deliver an analysis based on hard data, not just on theoretical models.
A well-structured analysis takes into account:
clarity of roles.
operational and communication efficiency.
alignment between people and objectives.
shared values and behaviours.
indicators and control tools.
Through organisational analysis, your company can:
reduce costs and inefficiencies;
simplify decision-making processes;
make the most of staff skills;
foster collaboration between departments
be better prepared to face market changes.
Find out how our tailored analyses can help your company achieve its objectives with precision and effectiveness.
DILO (Day In the Life Of) mapping makes it possible to analyse how time is really spent on work activities. It is a practical tool for highlighting inefficiencies, rebalancing workloads and supporting organisational decisions based on objective data.
“We don’t have time”, “We’re always swamped”: how often do you hear these phrases at work?
Time is a key resource, yet how it is managed often remains largely invisible.
Knowing how and where time is really spent is the first step towards improving performance and organisational satisfaction.
DILO (Day In the Life Of) is a tool for objectively mapping the daily activities carried out by people in the company. Each participant records their daily activities, generating valuable data that is analysed to obtain operational and organisational insights.
By classifying activities as core / non-core and efficient / inefficient, the DILO tool makes it possible to:
In the initial phases, the quality of the data collected is ensured through active support while the activity logs are being filled in.
The value of the mapping is not just analytical, but operational. Thanks to the categorisation of activities, we can:
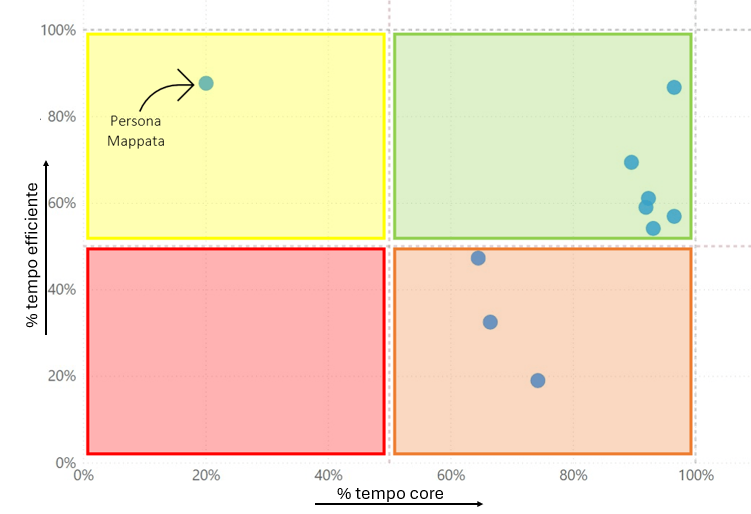
The output is divided into 4 quadrants:
The ideal area: core activities, carried out by people with the right skills, with high efficiency.
Includes efficient activities that fall outside the role: responsibilities need to be reallocated.
Flags activities that belong to the role but are inefficient: the method or priorities need to be improved.
Highlights ineffective activities outside the person’s remit: they require urgent action.
The interactive report is designed to guide you through the main findings of the mapping.
Through 7 different views, you can explore:
between core/non-core and efficient/inefficient activities
common ones such as email, meetings and training
with the prevailing causes highlighted
across departments
Browse freely between the report pages and view the data in charts and matrices for an immediate, complete analysis.
Request a consultation now